#STUDY: How To Trade Using Fibonacci Retracements | #FB #TSLA
Updated December 9, 2013 ● 2,032 views
Fresh Stocks News, Tips, and Ideas!
The Stocks Channel goal is to help fellow stock traders on making a profit! This channel features stocks news, stocks trading ideas, and stocks tips from fellow Dizkover members. We are mostly traders by profession.
Dizkover Members Get The Tips First!
A lot of our members are also active at Stocktwits and Yahoo finance boards. But often, Dizkover members get the tips fist. So checkout out the Stocks Channel often for fresh stock trading tips!
Join Stocks Channel!
Stocks Channel is open for everyone. Whether you are a findamental or technical trader, you are welcome to share your own trading ideas and tips.
Common Hashtags:
- #StockIdeas - stock trading ideas supported by technical analysis or fundamentals
- #StockNews - stock market news
- #TradingStrategy - stock trading strategy and tips
- #long and #short - suggestion to go long or short
Terms Of Use:
Trade at your own risk! We are not responsible in the event of trading loss. Always use your own research and analysis before you trade. Any tips and recommendations you find at thie website can be wrong.

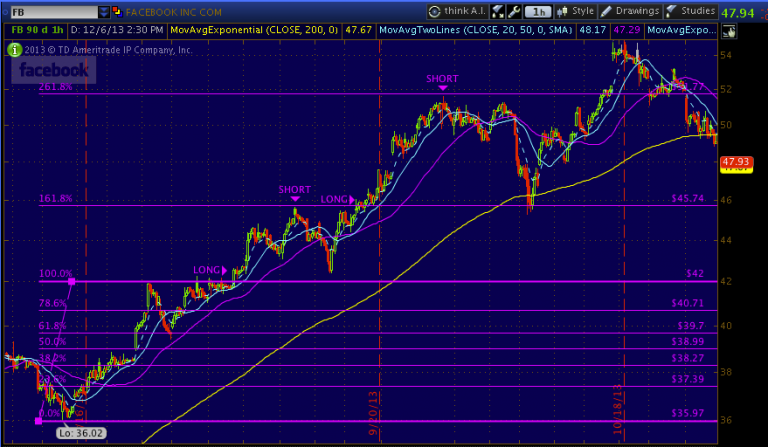
I posted this chart a couple months ago on Stocktwits explaining how I made huge profits trading momentum stocks such as Facebook (FB) and Tesla (TSLA). I just want to share this here to help you on your own technical analysis.
I'm a technical trader. My two favorites in technical analysis are Fibonacci Retracements and Fibonacci Extensions. I love trading resistance breakouts in Fibonacci retracements. I always put an assumption that momentum stocks, will usually bounce back higher after it retrace back from support level.
If you look at the chart of Facebook back in August and September, there were 2 huge opportunities to make huge profits. That's on the breakout past the 100% and 161.8% levels. When I placed my trades, I targetted the price on 161.8% and 261.8% levels.
Another example chart here is Tesla (TSLA). If you look at the chart, the price action perfectly traced the Fibonacci levels. If you trade all the breakouts pass the resistance, you would have made huge profits!
Why are the price action perfectly traced at Fibonacci levels?
Professional traders around the world are watching these levels to place buy or sell orders. Therefore, these levels has become a self-fulfilling expectation.
Base on my experience, trading breakouts will most likely be winning trades. To limit risk, put your stop-loss below the breakout price level.
On next #STUDY, I will write about trading Fibonacci Extensions. An example is my options trade on AAPL and YHOO last week where I made profit close to 300% in just few days.
Goodluck on your trading.
Past trading recap:


Good explainer on Fibonacci trading!
money101 · 10 years agopermalink · reply (0)
Are you a professional trader? I'm looking at your posts here and I can say you really know technical analysis. Your posts are really helpful. Good job!
TradeKing · 10 years agopermalink · reply (0)
Wow. Those price actions exactly trace the retracement levels! I really need to get more into technical analysis. Thank you for this post!
JoeBiggs · 10 years agopermalink · reply (0)